
It’s one of those assumptions that pops up with alarming regularity.
‘It’s terrible, isn’t it? Marriages are doing so badly. Surely you can’t really think getting married is a good idea?’
I get this a lot in radio interviews. And you probably see it in the newspapers or hear it on the radio or in the pub as well.
Except that it’s completely wrong.
The reality is that divorce rates have now fallen to levels not seen since the 1960s. The main driver of family breakdown is the disproportionate break-up of unmarried couples.
In a new paper released today to mark the beginning of Marriage Week UK, 13-19 May, I’ve looked at the lifetime risk of divorce for every year of marriage going back to 1963.
By mapping divorces by duration of marriage – ie those that lasted one, two, three years etc – onto the relevant year of marriage, I can explore a much richer pattern of divorce trends than anything you’ll see elsewhere.
For couples who married a long time ago, I can rely on actual data. For couples who married more recently, I have to rely on the how many couples divorced last year after, say, 10 or 11 or 12 years of marriage.
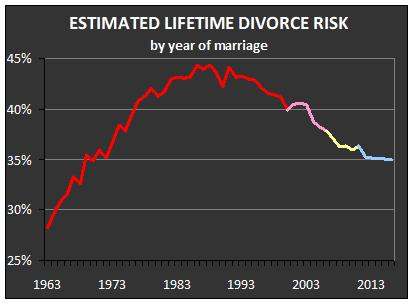
The chart above shows the big rise in divorce for couples marrying in the 1960s and 1970s, a long peak for couples who married in the 1980s and 1990s, and then a big improvement thereafter – which shows no sign of stopping.
I have written elsewhere why I am convinced the reason for this rise and fall is best explained by social rather than legal changes, especially since most of it involves changes in wives – rather than husbands – filing for divorce.
The good news is that my estimate of lifetime divorce risk for today’s newlyweds – at 35 per cent – is back to levels not seen since 1969.
The worst years to get married were more or less any time in the 1980s or 1990s where divorce rates were consistently over 42 per cent.
The worst year itself was 1986, my own wedding year! A record 44 per cent of couples marrying then either have or will get divorced.
You can check your own wedding year in the table below.

Boring technical notes:
You may have read an estimate from the Office for National Statistics a few years ago that the lifetime divorce risk is 42 per cent. That analysis – using exactly the same methodology that I use – was based on couples marrying in 2010.
My updated estimate for 2010 couples is 36 per cent. This number is lower than 42 per cent in part because divorce rates in the early years of marriage have fallen. That would bring the updated figure for 2010 down to 40 per cent.
However the drop from 40 to 36 per cent happens because I also add an estimate for overseas weddings in my calculations. Every year, ONS publishes data on this from the International Passenger Survey. It shows that up to 63,000 people – yes! – get married overseas. What I do is add half of this number which boosts the total number of weddings in any given year by between 3 and 8 per cent. This in turn reduces divorce rates because they are based on a larger number of marriages.
ONS don’t do this because overseas weddings is an estimate and not an exact number. But their inclusion definitely gives a more accurate picture of divorce rate trends.
One other hurdle I have to negotiate is that ONS don’t routinely publish the relevant divorce numbers for each year of marriage. Instead they group them together into blocks of five years, which is infuriating!
So unless I cough up £300 and commission them to give me the full set of numbers – which I did for this latest analysis – I have to extrapolate the proportion of divorces in each of these years using previous trends.
I am in the process of asking them nicely …