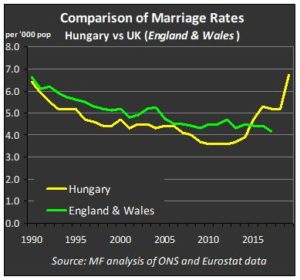
I recently interviewed Hungary families minister Katalin Novak to find out why their marriage rates have soared by 72% in just five years. Her answer is that Hungary has given clear financial incentives and public support for marriage since 2015. Contrast this with UK family policy that pays couples £250 to get married but £10,000 if they don’t.
Marriage rates are showing clear signs of levelling off across Europe. My analysis of Eurostat data shows that half of all European countries have seen marriage rates rise in the past five years and 40% have seen a rise over ten years.
However the standout performer is Hungary where the marriage rate in 1990 was up by 72% since 2014 – and number of weddings up by 69% – comfortably the highest rise in Europe, if not the world.
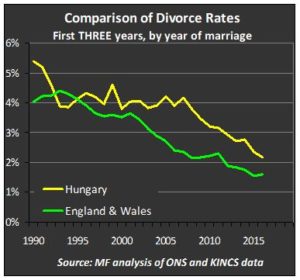
Hungary has not seen this number of weddings since 1990. Note also that the big increase in weddings has not led to a big rise in divorce. In fact the opposite has happened as divorce rates continue to fall for couples who married in 2015 or 2016.


By way of comparison, and leaving aside Cyprus where marriage rates were up by 41% over five years, the next highest rises among major European countries were +24% in Bulgaria, +19% in the Czech Republic and +18% in Austria. Marriage rates in the UK have barely budged since the mid-2000s.
So what is driving this rise?
According to Hungarian families minister Katalin Novak, who was kind enough to talk to me via teams recently, there are two reasons.
The first is a series of policies that provide financial incentives for couples who are married, first introduced in 2015. Among these are two options to apply for government-backed loans, equivalent to Eur30,000 each, at a low interest rate. One loan is unsecured and can be used for anything. The other loan can only be used for specific new housing projects. For couples who have two children – or say that they will in the future – 30% of the loans are written off. For those with three children the loans are written off altogether.
The main purpose of these policies is to address Hungarian demographic imbalances and boost the birth rate. Although any parent, including lone parents, can apply based on their existing children, the write-offs only apply for married couples aged 18-40 who have children in the future.
The second is the mentality and values base behind the policy. Hungarian politicians are unashamed about their active support for marriage, which includes legal rights, public awards, and speaking about marriage. In 2017, the government also set up a national institute for family research that provides the evidence base and analysis for public policy on the family.
The result is a 69% rise in weddings that very obviously begins in 2015.
Contrast the effectiveness of the financial incentives and unashamed support for marriage in Hungary with the exact opposite in the UK.
UK politicians will tell you how the tax system provides a transferrable tax allowance worth £250 per year for some married couples. What they won’t tell you is that the benefit system penalises married couples by up to £10,000 per year in lost universal credit. This ‘couple penalty’ began with the introduction of tax credits in 2004 and has never been addressed and barely acknowledged.
It was certainly not acknowledged in a recent House of Lords debate where government spokesman Baroness Scott of Bybridge seemed strangely reluctant to acknowledge the substantial body of evidence showing that marriage is by far the most successful family form for couples and for children.
| Change in European marriage rates | ||
| Data from Eurostat | ||
| Country | 2019 vs 2009 | 2019 vs 2014 |
| Hungary | +81% | +72% |
| Cyprus | +14% | +41% |
| Bulgaria | +20% | +24% |
| Czechia | +11% | +19% |
| Austria | +21% | +18% |
| Luxembourg | +0% | +17% |
| Romania | +0% | +12% |
| Slovakia | +10% | +10% |
| Belgium | -3% | +8% |
| Portugal | -16% | +7% |
| Croatia | -6% | +7% |
| Estonia | +25% | +6% |
| Latvia | +46% | +6% |
| Denmark | -12% | +6% |
| Germany | +9% | +4% |
| Spain | -5% | +3% |
| Italy | -21% | +0% |
| Slovenia | +0% | +0% |
| Serbia | +2% | +0% |
| Albania | +16% | -1% |
| UK | +2% | -2% |
| France | -10% | -3% |
| Poland | -27% | -4% |
| Netherlands | -16% | -5% |
| Lithuania | +8% | -8% |
| Greece | -17% | -10% |
| Finland | -29% | -11% |
| Switzerland | -17% | -12% |
| Ireland | -15% | -13% |
| Norway | -20% | -13% |
| Sweden | -8% | -15% |
| Malta | -7% | -20% |

