Divorce rates are now back to 1970 levels, according to our new research using Office for National Statistics data. Download the research paper here.
Using the same method as ONS, we calculate divorce rates for every year of marriage since 1963.
We found that 1986 was the worst year for divorces with 41% of couples who married in that year having already divorced. On present trends, we predict that 44% will divorce altogether.
Comparing the first ten years of marriage, 18% of couples who married in 2010 divorced compared to 23% of the 1986 couples. So that’s a 24% reduction in divorce rates in the early years of marriage.
If we look at just the first five years the drop is even bigger: 5% of the 2015 newlyweds have divorced so far compared to 10% for the 1986 couples. That’s a drop of 48%.
Using the most recent figures, we can predict that 35% of today’s newlyweds are likely to divorce. The way we do this is a bit like how Google Maps tells you how long your journey will take based on what everybody else is doing a bit further down the road. How long your actual journey takes will be close to that.
We have also shown that
- divorce rates peak in years 3-7 regardless of which year we look at
- after 10 years of marriage, divorce rates become highly predictable
- the blip in divorces in 2010 looks very likely to be due to faster processing of paperwork and not a higher divorce rate
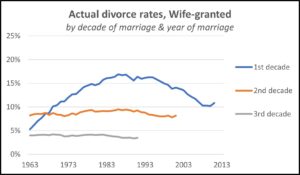
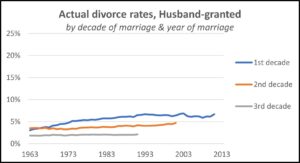
- whereas the rate at which divorces are granted to men has barely changed since the 1970s, almost all of the change in divorce rates since then has occurred among divorces granted to women in their first decade
- once we know the actual divorce rate over 10 years – i.e. up to 2010 – we can be really confident about predicting lifetime divorce risk for that year group
Why have divorce rates changed since the 1960s?
Look at the charts above. All of the change happens among women filing for divorce in their first decade of marriage. Almost no changes beyond that for women and almost no change at all for men.
If this was all about age or economics or more women in the workplace, we would expect to see similar variations in husband-granted divorces. We don’t. So this is a gender effect.
Why did women become progressively unhappier during the 1970s and 1980s and then progressively happier again since the 1990s?
My view is that this is all about men’s commitment. In the 1970s, more and more couples began to cohabit which almost certainly led to couples getting married due to social pressure. More uncommitted men means more women divorcing early on. But as social pressure to marry has all but disappeared, the men who marry are increasingly those who really buy into their marriages.
More deciders. Fewer sliders.
So much for toxic masculinity. At least as far as married men are concerned, it’s been waning since the 1990s!
Harry Benson, Research Director, Marriage Foundation, November 2023